Trusted by 10,000+ organizations globally






Your foundation for responsible business leadership
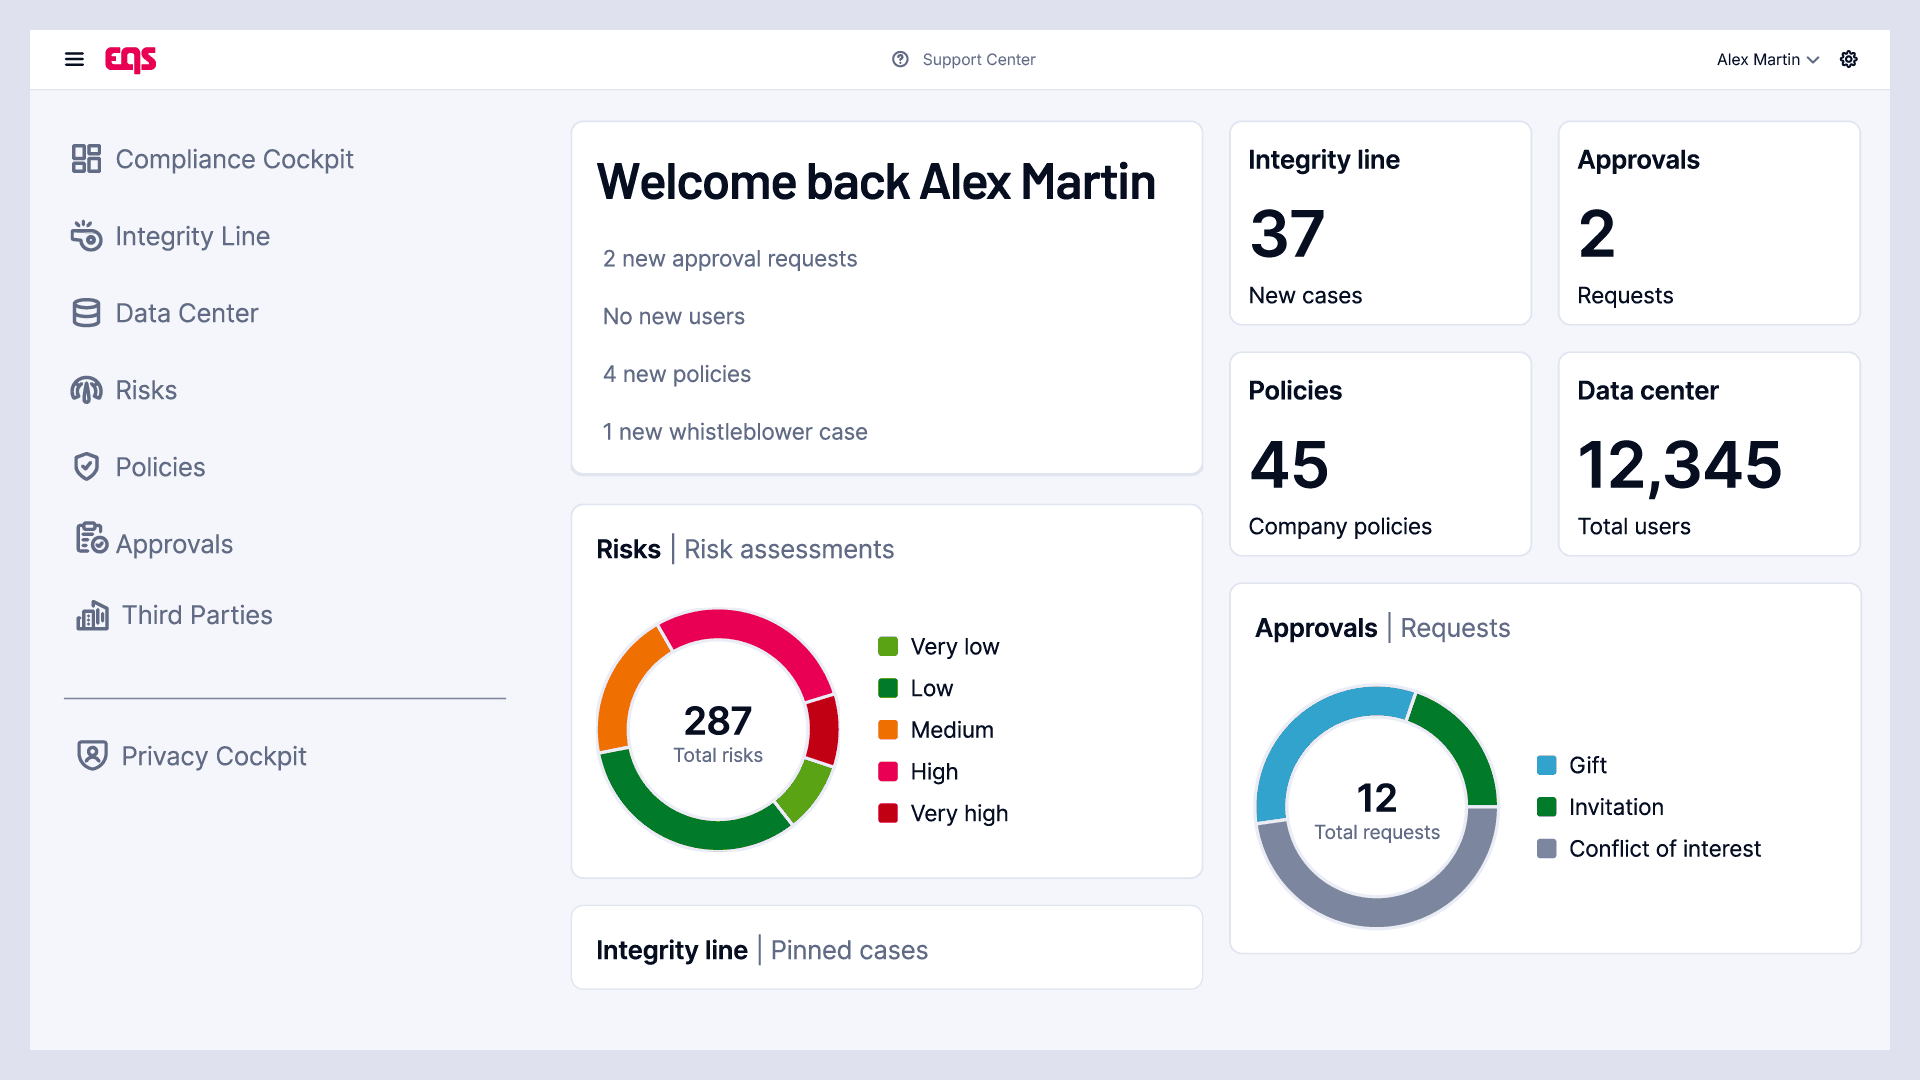
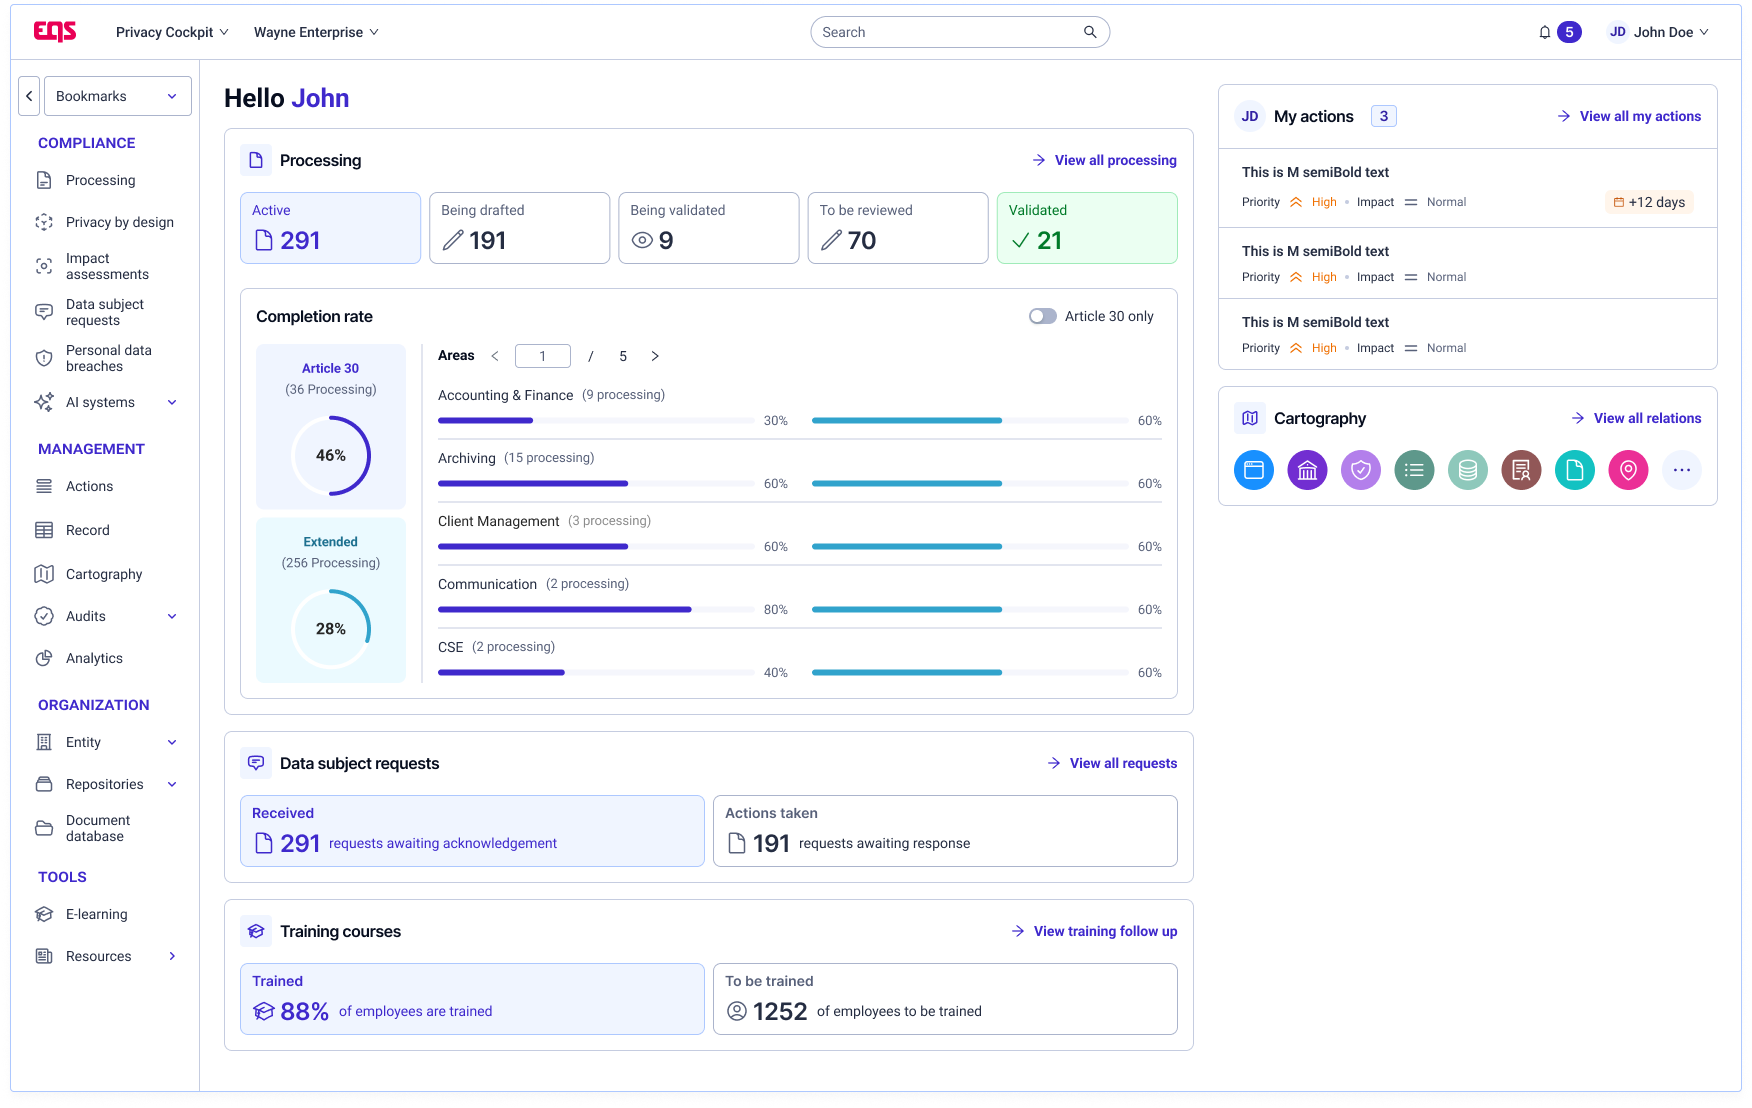
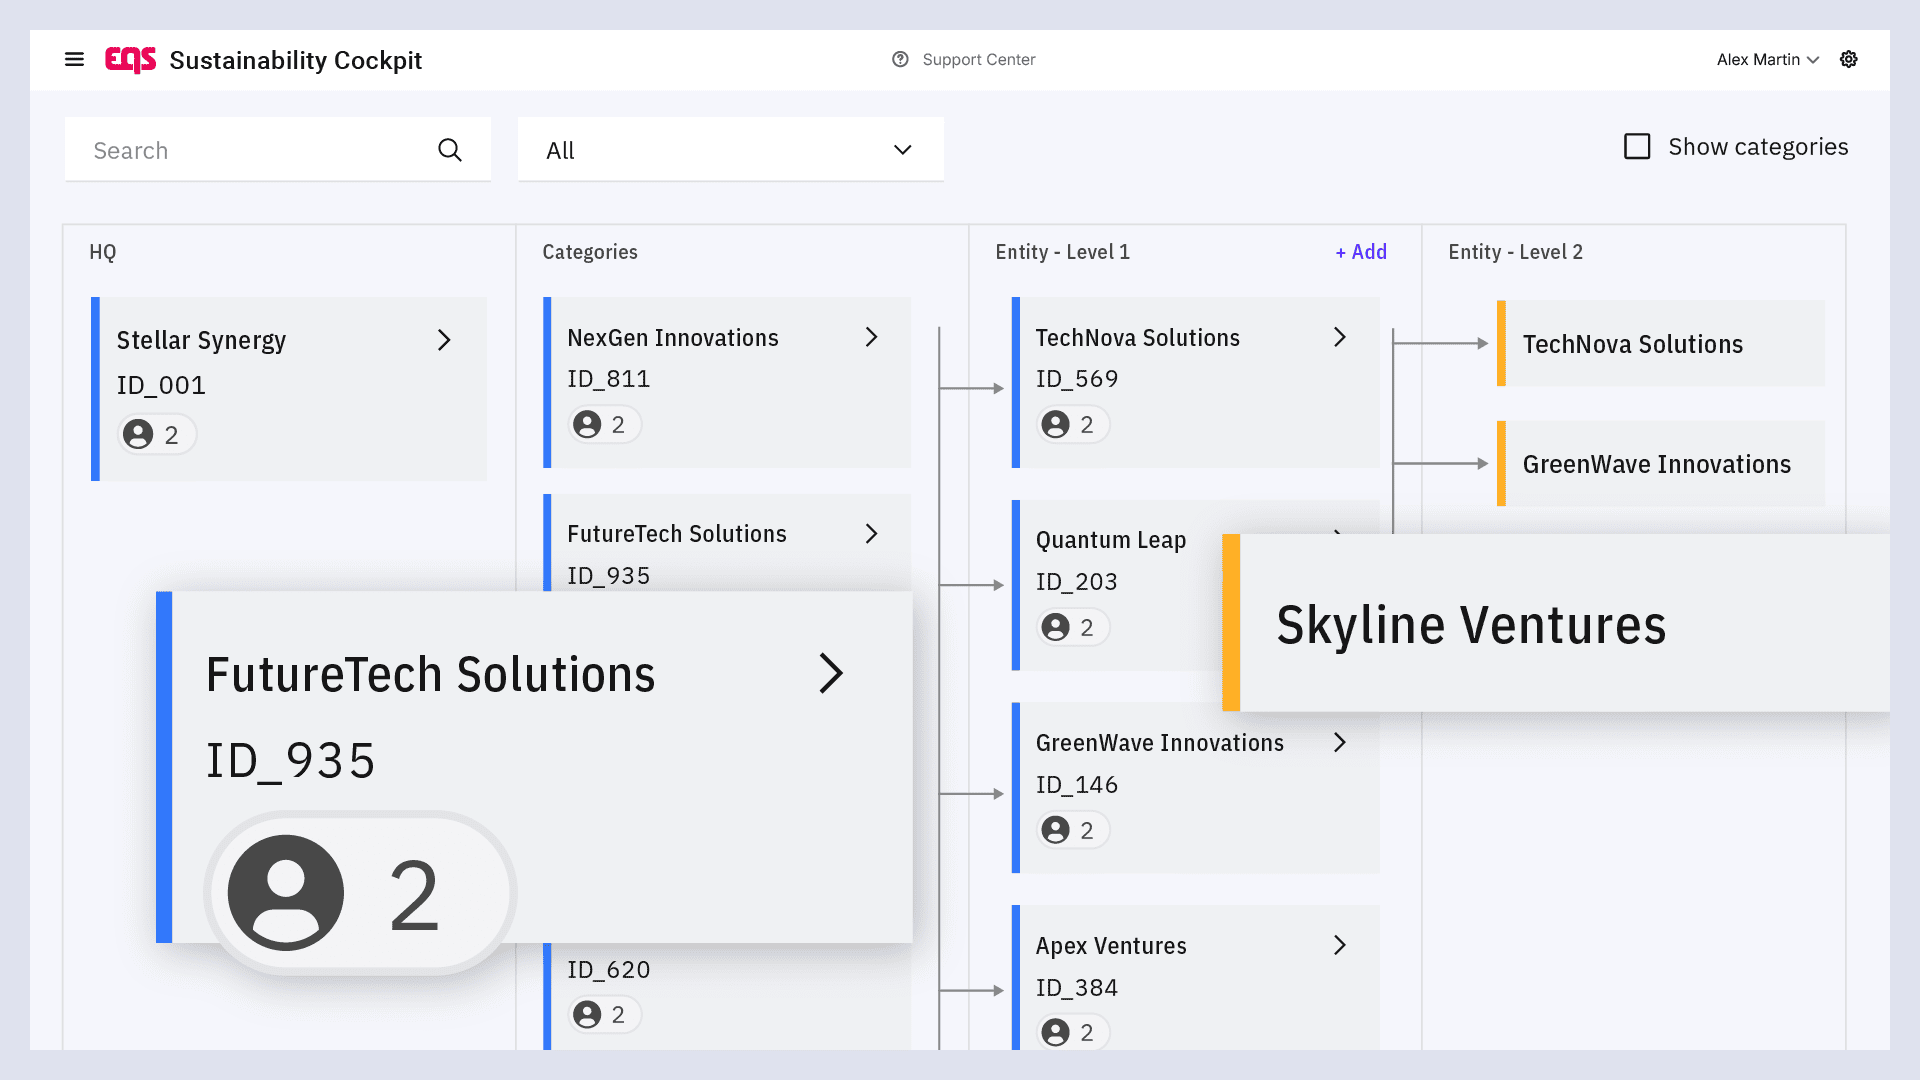
We combine effective compliance management, advanced data protection, and comprehensive sustainability reporting to help organizations such as yours build trust and drive positive impact.
A unified approach to trust & transparency
What our customers say

We wanted to set up a system that would inspire confidence among employees and be user-friendly for reporting. At the same our compliance team needed a professional and efficient case management solution.
We evaluated several providers and we found out that EQS Group provided the simplest and most straightforward product, thus the best solution for our requirements.
Kristina Schmieg, Senior Manager Compliance
PUMA SE
Why customers love us
Find out why business leaders choose EQS
Who we are
At EQS, our work is driven by a single question every day: How can we help companies navigate rising complexities better while staying true to their values? Since 2000, we’ve supported organizations in building trust – turning compliance, investor relations and sustainability challenges into opportunities.
Resources to learn more about EQS
Make compliance work for you
Your time is valuable. See how leading organizations use EQS Group to turn compliance and sustainability challenges into business advantages. Let’s talk.

